AIXX Compute Market Monthly Report · Nov 2026
Compute asset market led by B300: indices, premium structure and the full supply-demand picture
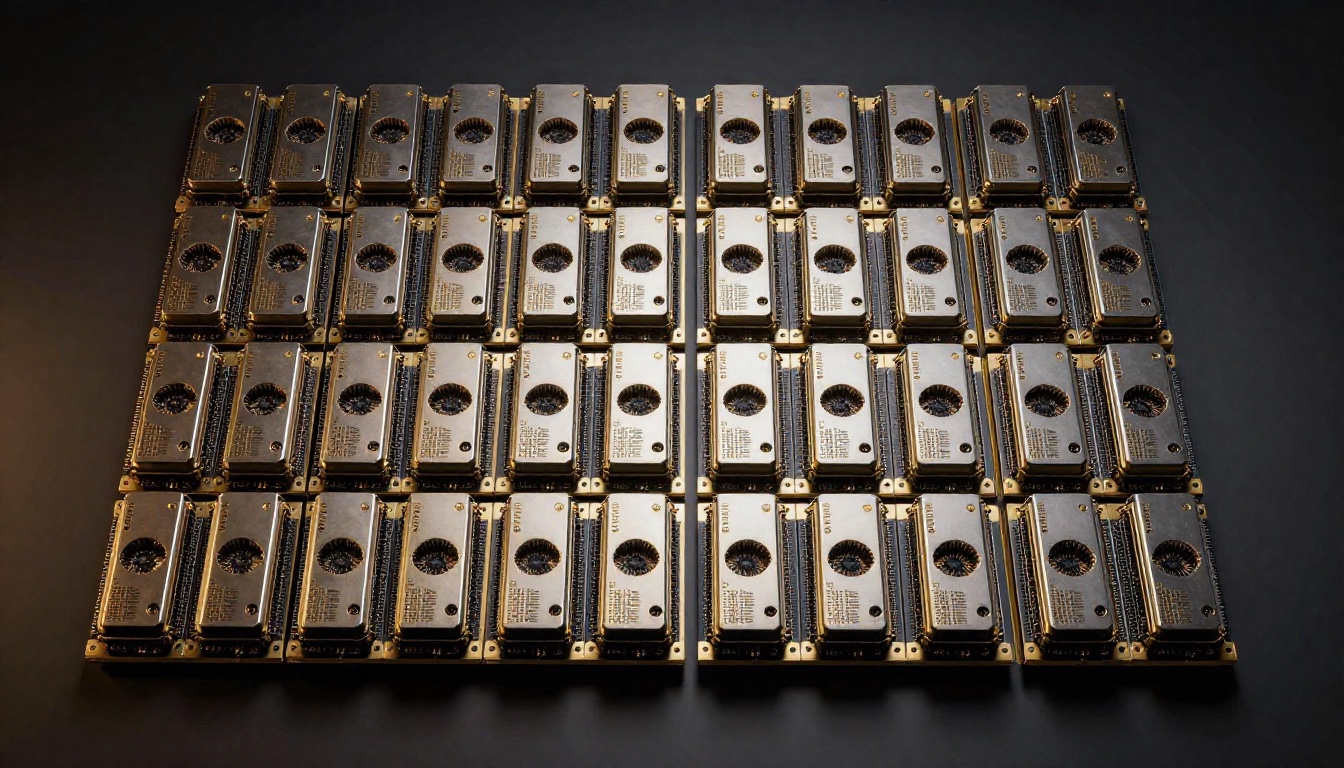
Summary · EXECUTIVE SUMMARY
- Price: The B300 market index rose 13.9% in October, up +141% year-to-date; the HGX H100 index is up +262% YTD, as flagship compute assets extend a strong pricing cycle.
- Structure: Same-generation compute assets show a pronounced premium gradient across fourteen markets — Mainland China trades at 152% versus the US baseline, while India is the only discount market (-12%).
- Supply-demand: 363 verified listings correspond to 16,800 verified buy orders; scarcity stands at 46.3 : 1, and the seller's market remains intact.
1. Market Overview
Data in this report are drawn from the AIXX public market standard (listing market data, official statistics and index pipeline), covering 40 assets across GPU full systems, single cards, networking and storage, in eight major compute market regions.

2. Price Trends: A Strong Pricing Cycle for Flagship Compute Assets
Normalized to a base of 100 on the first recorded day of November 2025, the B300 and HGX H100 market indices have gained 141% and 262% year-to-date respectively; in October alone, B300 rose another 13.9%, with no sign of slope convergence. Indices are weighted by listing market data, reflecting market pricing trends for tradeable inventory.
Methodology note: first recorded day = 100 for each asset. Index lines include pipeline backfilled roots (B300 275 root / H100 300 root are estimated); from 2026-09-16 onward, data are pipeline-recorded. Indices are relative scales and constitute no pricing commitment.
3. Market Structure: Premium Gradient Across Fourteen Markets
Compute assets are not priced uniformly worldwide: taking US-region markets as the baseline, the B300 listing medians across fourteen markets form a premium gradient from 152% (Mainland China) to -12% (India, the only discount). Mainland China's high premium is jointly driven by tariff and compliance-channel costs plus regional supply-demand gaps — it is structural rather than arbitrable, as cross-border delivery is constrained by export controls and the spread cannot be closed by trade flows.
4. Listing Price Bands & Asset Ratings
The table below lists assets with genuinely active listings this month (public listing market standard, unit: CNY 10k per unit/set); price bands are P10–P90 percentile ranges with full-system outliers removed. Listed reference price ≠ transaction price; ratings are AIXX Market's composite assessment of liquidity/return/supply-demand.
| Asset | Listing price band (10k CNY) | Active n | Median | Rating |
|---|---|---|---|---|
| HGX B300 NVL16 | 945.8 ~ 1821.2 | 12 | 1236.2 | C |
| B300 | 1529.4 ~ 1758.8 | 7 | 1701.3 | B+ |
| DDR5 RDIMM 128G | 9.5 ~ 71.7 | 7 | 64.8 | A+ |
| Liquid-cooling CDU | 108.2 ~ 411.0 | 6 | 114.6 | A+ |
| MI300X | 156.8 ~ 559.0 | 5 | 166.5 | A |
| Quantum-2 X800 | 53.4 ~ 213.4 | 4 | 179.2 | A+ |
5. Rental Rates & Supply-Demand

B300 Card-Hour Rental Rates (11-Market Panorama)
- 363 active listings vs 16,800 verified buy orders; scarcity at 46.3 : 1 (official statistics standard, same source as the hall).
- Rental rates are estimated · true-anchored (B300 converted by generation), not listing prices.
- Mainland China rental rates eased mildly over 15 days (-1.0%), North America flat, Tokyo firmer (2.8%), Europe 0.3% — regional power and data-center supply differences are the main driver.
6. Methodology, Standards & Disclaimer
Price band standard: P10–P90 percentiles with outliers removed; listed reference price ≠ transaction price.
Snapshot times: Market lines 2026-10-25 · Official statistics 2026-11-02 · Index panel 2026-10-25T21:50.
Disclaimer: This report is auto-generated by the AIXX market data pipeline from platform public data, for industry reference only; it constitutes neither investment advice nor a pricing commitment. Reprints must credit "AIXX Market" and link to the original article.
© AIXX Compute Exchange · AIXX Compute Market Monthly Report Nov 2026 · Fixed monthly column · Reprints must credit the source and link to the original · For industry reference only, not investment advice